Europe · 2026/27
UEFA Nations League A
4 groups, 36 games played so far. Portugal have 4.8 more points than their chances deserve.
- Matchday
- 5
- of 5
- Goals / game
- 3.03
- 109 in total
- xG / game
- 3.23
- goals −7.4 vs xG
After 5 matchdays
The groups
Group 1
Points as they stand. Switch to the deserved table to rank every team by expected points from the chances in each game.
| # | Club | P | GD | Pts |
|---|---|---|---|---|
| 1 |  ItalyItaly | 5 | +5 | 10 |
| 2 |  FranceFrance | 5 | +3 | 10 |
| 3 |  BelgiumBelgium | 5 | +2 | 9 |
| 4 |  TurkiyeTurkiye | 5 | −10 | 0 |
Group 2
Points as they stand. Switch to the deserved table to rank every team by expected points from the chances in each game.
| # | Club | P | GD | Pts |
|---|---|---|---|---|
| 1 |  NetherlandsNetherlands | 4 | +2 | 8 |
| 2 |  GreeceGreece | 4 | +2 | 8 |
| 3 |  GermanyGermany | 4 | +1 | 5 |
| 4 |  SerbiaSerbia | 4 | −5 | 0 |
Group 3
Points as they stand. Switch to the deserved table to rank every team by expected points from the chances in each game.
| # | Club | P | GD | Pts |
|---|---|---|---|---|
| 1 |  SpainSpain | 5 | +9 | 15 |
| 2 |  EnglandEngland | 5 | +12 | 12 |
| 3 |  CroatiaCroatia | 5 | −11 | 3 |
| 4 |  CzechiaCzechia | 5 | −10 | 0 |
Group 4
Points as they stand. Switch to the deserved table to rank every team by expected points from the chances in each game.
| # | Club | P | GD | Pts |
|---|---|---|---|---|
| 1 |  PortugalPortugal | 4 | +5 | 12 |
| 2 |  DenmarkDenmark | 4 | 0 | 6 |
| 3 |  NorwayNorway | 4 | −2 | 3 |
| 4 |  WalesWales | 4 | −3 | 3 |
xG under every score
Fixtures and results
Thursday 12 November
Times in London time.
Best eleven by match rating
Team of the round
From all 4 games
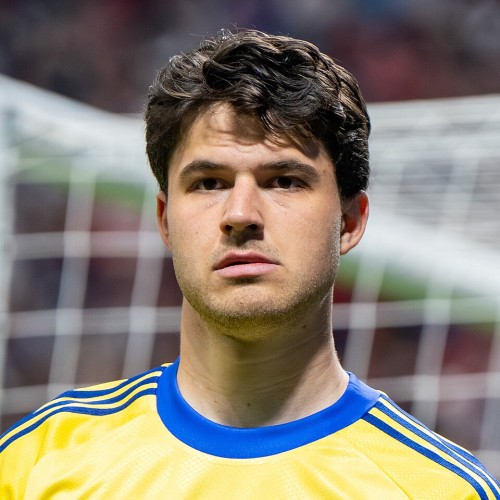

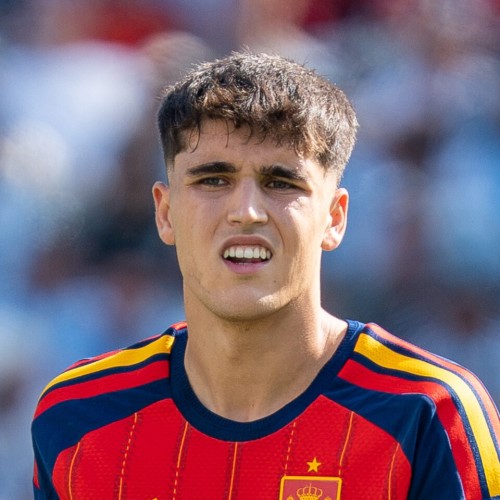
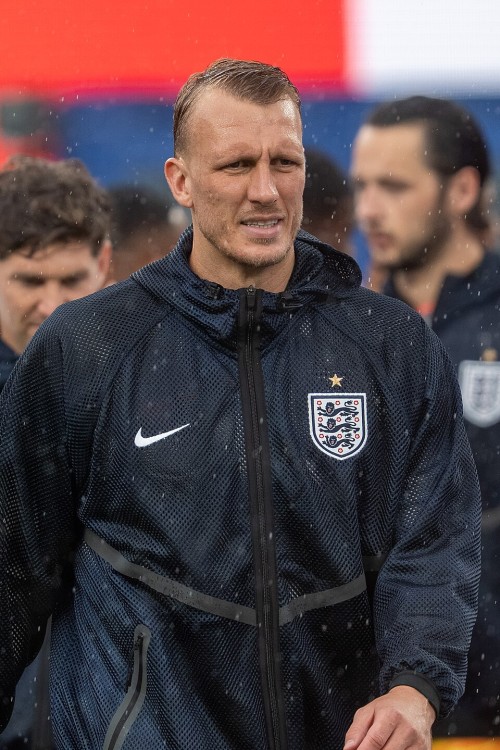

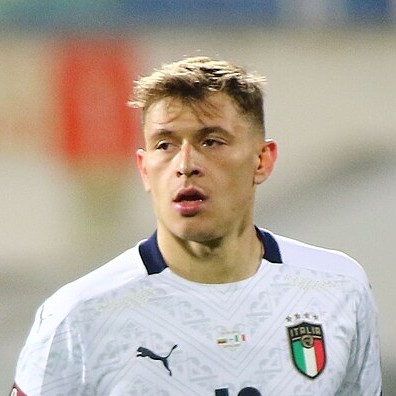
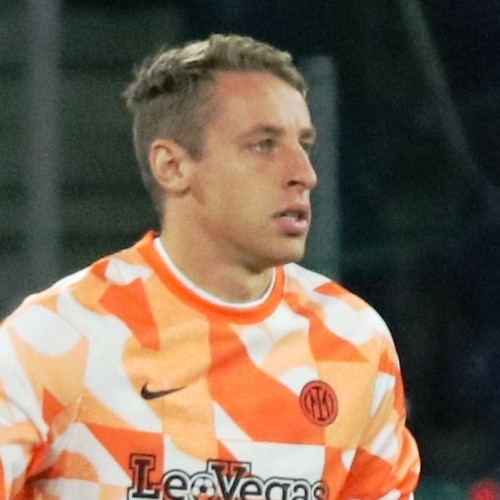



8.9
rating
2
goals

1
assist
1.28
xG
Players need 45 minutes in a game to make the team. Goals, assists and xG count from any minutes.
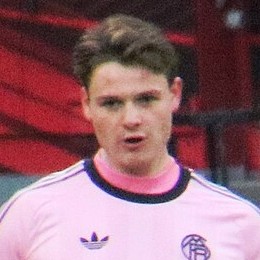
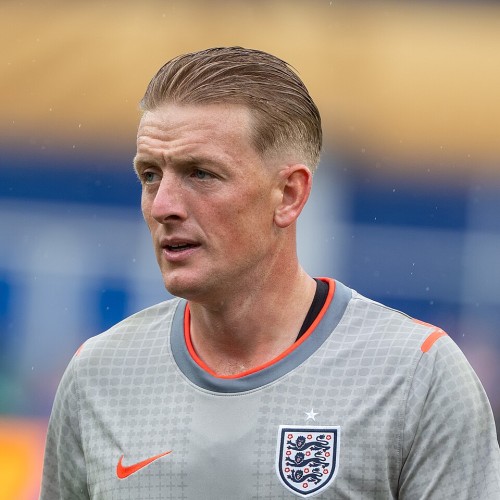
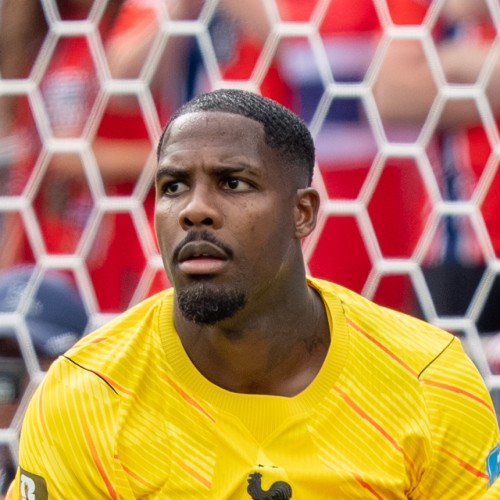
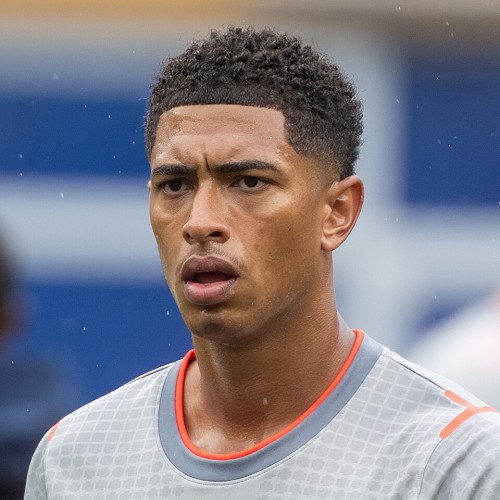
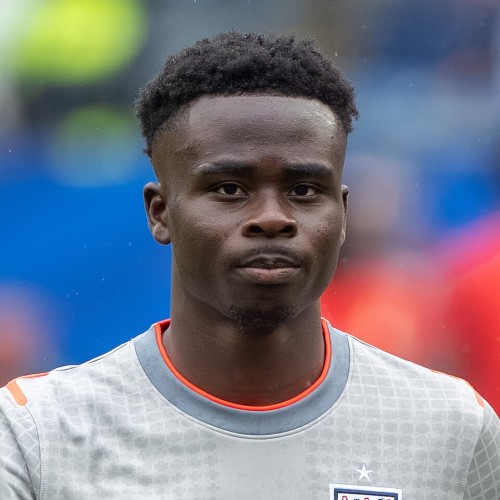
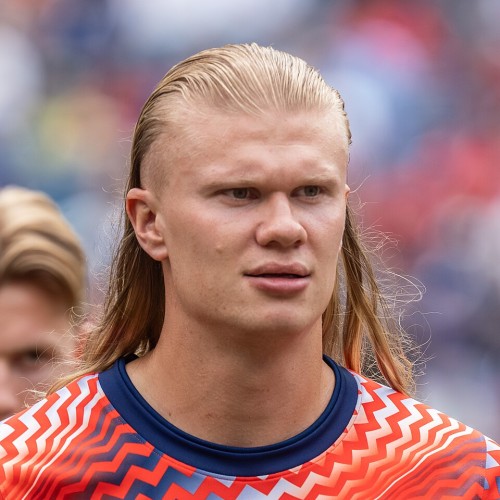
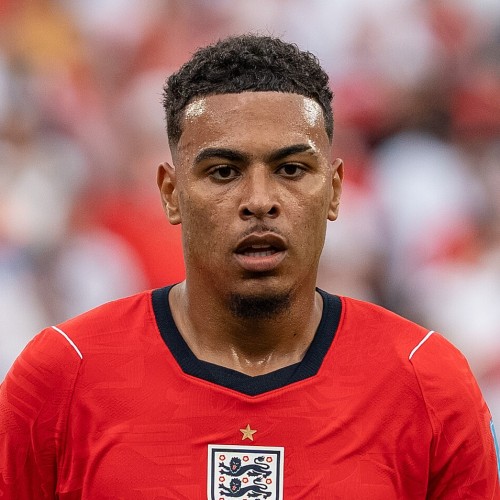
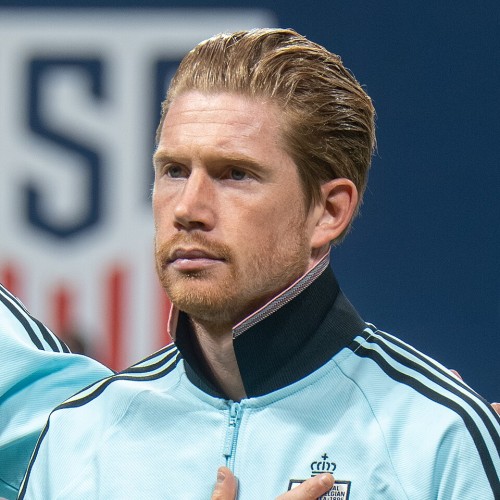
Photos: Bryan Berlin / CC BY-SA 4.0 · AFC Bournemouth / CC BY 3.0 · Biser Todorov / CC BY 4.0 · Werner100359 / CC BY-SA 4.0 · LawEnthusiast / CC BY-SA 4.0 · NewMicrosoikos / CC0
UEFA Nations League A 2026/2027
Who leads the numbers
Goals and assists
Goals
Penalties included
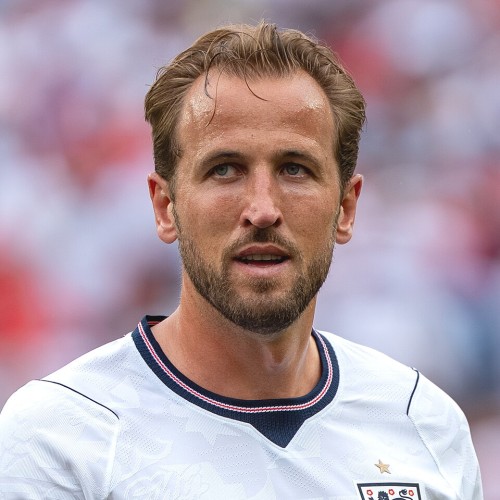
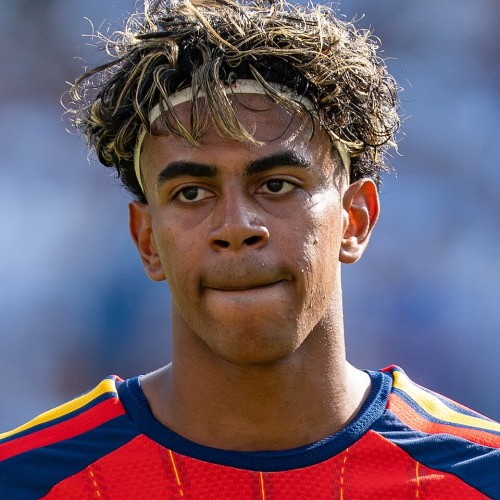
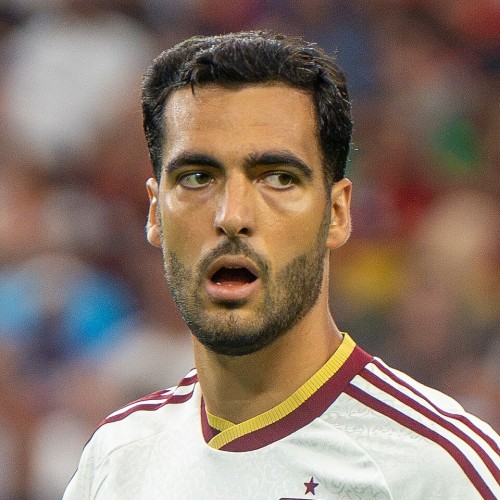
Assists
Final pass before a goal
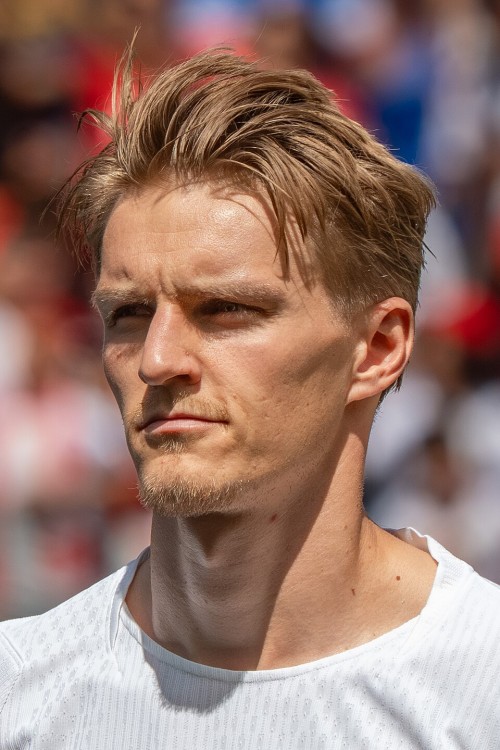
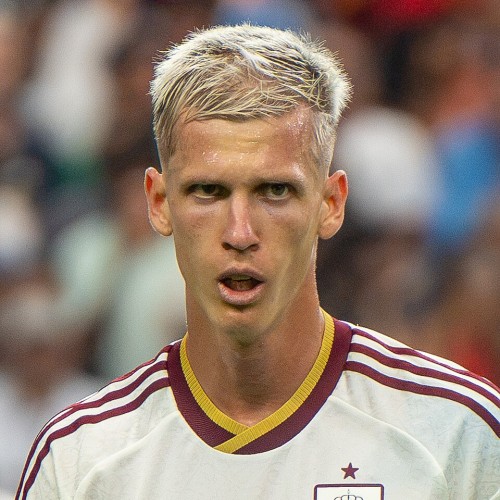

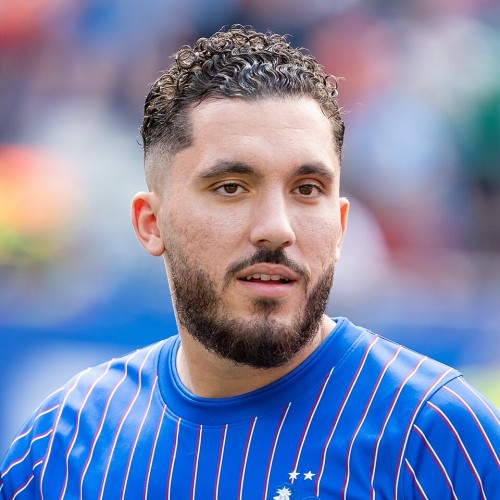
Goals + assists
Direct goal involvements
Chances and attacking
Expected goals
Quality of chances taken
- 1KaneEngland4.5
- 2MeerdinkNetherlands3.1
- 3HøjlundDenmark2.6
- 4SakaEngland2.5
- 5HaalandNorway2.5
Expected assists
Quality of chances made
- 1BellinghamEngland2.1
- 2Bruno FernandesPortugal1.6
- 3TreuGermany1.6
- 4RogersEngland1.5
- 5GordonEngland1.4


Shots
Every attempt at goal
Key passes
Passes that led to a shot
- 1BellinghamEngland16
- 2VeermanNetherlands15
- 3DembéléFrance11
- 4Bruno FernandesPortugal11
- 5De BruyneBelgium11

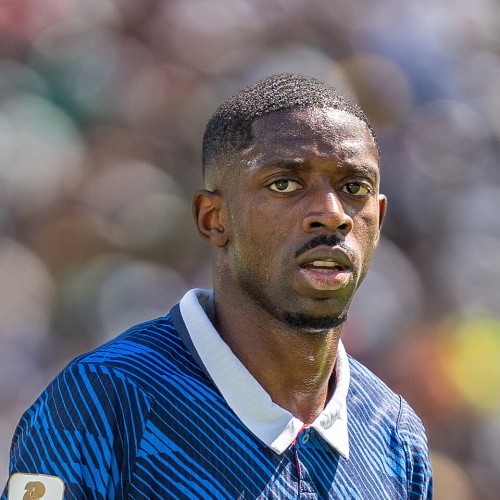
Dribbles
Take-ons completed


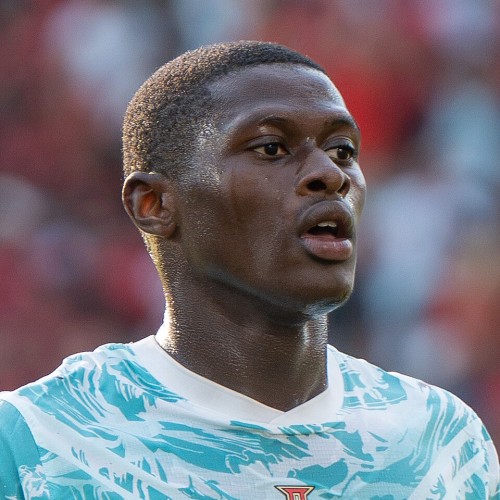
Per 90 minutes
Players with 450+ minutes
npxG per 90
Non-penalty xG
- 1GvardiolCroatia0.05
- 2CastagneBelgium0.02
- 3NgoyBelgium0.02
- 4MecheleBelgium0.01
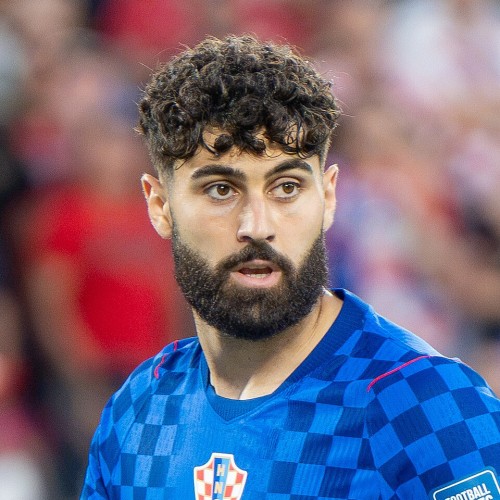

xA per 90
Expected assists
- 1CastagneBelgium0.05
- 2GvardiolCroatia0.01
- 3NgoyBelgium0.00
- 4MecheleBelgium0.00
Defending and keepers
Tackles + interceptions
Ball won back



Saves
Goalkeepers
Clean sheets
Goalkeepers