Norway 1-2 England, World Cup

- Kick-off
- Venue
- Miami Stadium
- Referee
- Clément Turpin
- Attendance
- 64,478
Norway 1-2 England. xG 0.7-1.1.
Ratings out of 10
Line-ups and ratings
Norway
4-3-3 · Ståle Solbakken
Avg rating 6.61
England
4-2-3-1 · Thomas Tuchel
Avg rating 7.10

Nyland
#1 · Goalkeeper · Norway
120′ played
No numbers for him yet. They come in every few minutes while the game is on.



Heggem
#17 · Centre-back · Norway
90′ played
Off 91′
No numbers for him yet. They come in every few minutes while the game is on.









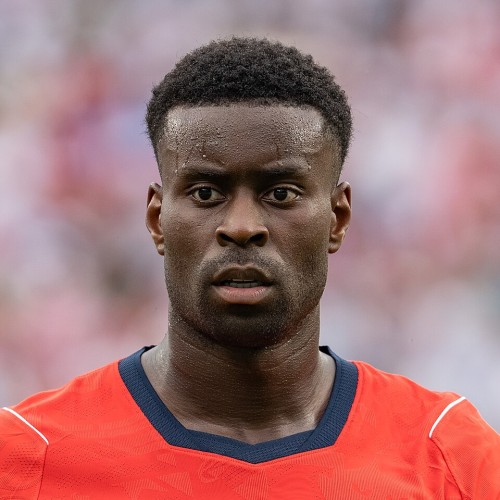





Bellingham
#10 · Attacking midfielder · England
111′ played
2 goalsOff 111′Player of the match
Passing
- xA
- 0.01
Attack
- xG
- 0.61


Bench
 6.3
Østigard
#4 · Substitute · Norway
30′ played
On 91′
No numbers for him yet. They come in every few minutes while the game is on.
 6.2
Strand Larsen
#11 · Substitute · Norway
15′ played
On 106′
No numbers for him yet. They come in every few minutes while the game is on.




Bench

Burn
#15 · Substitute · England
9′ played
On 111′
No numbers for him yet. They come in every few minutes while the game is on.





Tap a player who has played to see his numbers from this game. Photos: Bryan Berlin / CC BY-SA 4.0
Side by side
The numbers
- 48%Possession52%NOA 48%, ENG 52%.
- 0.68Expected goals (xG)1.06NOA 0.68, ENG 1.06.
- 0.68Non-penalty xG1.04NOA 0.68, ENG 1.04.
- 0.42xG on target2.64NOA 0.42, ENG 2.64.
- 13Shots14NOA 13, ENG 14.
- 4On target8NOA 4, ENG 8.
- 1Big chances2NOA 1, ENG 2.
- 577Passes628NOA 577, ENG 628.
- 86%Pass accuracy90%NOA 86%, ENG 90%.
- 7Corners4NOA 7, ENG 4.
- 24Tackles15NOA 24, ENG 15.
- 9Interceptions6NOA 9, ENG 6.
- 8.1PPDA (lower = more pressing)7.6NOA 8.1, ENG 7.6.
- 10Fouls8NOA 10, ENG 8.
- 1Yellow cards0NOA 1, ENG 0.
- 0Red cards0NOA 0, ENG 0.
Minute by minute
Every moment
 Norway
 England
- 36′
 Goal, Schjelderup (Ødegaard)1–0
- 45+2′Goal, Bellingham (Gordon)1–1
- 46′Substitution, Saka (Off Rice / Madueke)
- 46′Substitution, Eze (Off Rice / Madueke)
- 60′
- Substitution, Nusa (Off Sørloth / Schjelderup)67′
- Substitution, Bobb (Off Sørloth / Schjelderup)67′
- 71′
- 86′
- 89′
- 90′
- 91′
- 93′Goal, Bellingham1–2
- Substitution, Strand Larsen (Off Haaland)106′
- 111′Substitution, Burn (Off Bellingham)
- Yellow card, Ajer117′
Photos: Bryan Berlin / CC BY-SA 4.0
27 shots
Every shot
← ENG attack
NOA attack →
- Goal
- Saved
- Missed or woodwork
- Blocked
- Bigger = higher xG
Expected goals, minute by minute
How the game flowed
Norway0.68xG
England1.06xG
Full time1–2
Each step is a shot, its height the chance it was a goal. Drag across the chart to replay the game.
Average positions and passing links
Pass networks
Tap or hover a player to see who they passed with and how often.
Tap or hover a player to see who they passed with and how often.
Norway leaned more on one or two passers (centralisation 0.07 against 0.06).
Centralisation index runs from 0, when every player made the same number of passes, to 1, when one player made them all. Higher means the play ran through fewer players. Attacking to the right.