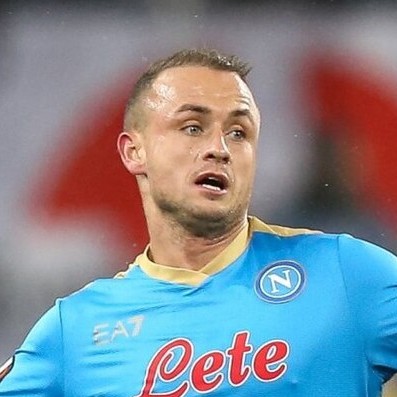
 Napoli
- Games
- 12
- 9 starts
- Minutes
- 753
- 63 a game
- Goals
- 1
- 0.5 xG
- Assists
- 0
- 0.5 xA
Player profile
753 min · vs 165 central midfielders · 3 Nov 2026 · Method
Archetype: Tidy, controlling midfielder
Lobotka keeps the ball, with pass accuracy of 91.2%, percentile 83, and wins 58.5% of his duels. He has 1 Serie A goal. He creates little, rarely dribbles and makes few tackles or interceptions. From 753 minutes.
Key strengths
Safe in possession. Pass accuracy of 91.2%, percentile 83.
Wins his duels. Duels won at 58.5%, percentile 83.
Moves it forward. 6.93 passes into the final third per 90, percentile 61.
Areas for development
Little creation. 0.60 chances created per 90, percentile 19.
Light defensively. 1.31 tackles per 90, percentile 26, and 0.60 interceptions per 90, percentile 23.
Rarely beats a man. 0.24 dribbles won per 90, percentile 18.
Similar players
- Jesper Karlström UdineseDribbles won 18 v 20 and key passes 24 v 25.
- Tanner Tessmann LyonExpected assists 31 v 31 and duels won 83 v 90.
- Simon Sohm VeneziaShots 23 v 20 and tackles 26 v 21.
Key strengths, areas for development and similar players
Key strengths
Safe in possession. Pass accuracy of 91.2%, percentile 83.
Wins his duels. Duels won at 58.5%, percentile 83.
Moves it forward. 6.93 passes into the final third per 90, percentile 61.
Areas for development
Little creation. 0.60 chances created per 90, percentile 19.
Light defensively. 1.31 tackles per 90, percentile 26, and 0.60 interceptions per 90, percentile 23.
Rarely beats a man. 0.24 dribbles won per 90, percentile 18.
Similar players
- Jesper Karlström UdineseDribbles won 18 v 20 and key passes 24 v 25.
- Tanner Tessmann LyonExpected assists 31 v 31 and duels won 83 v 90.
- Simon Sohm VeneziaShots 23 v 20 and tackles 26 v 21.
Against 171 central midfielders
Against the rest
How to read it. Each number is a percentile: the share of central midfielders with 450+ minutes this player beats on that measure. 90 means better than 90 out of every 100; 50 is the middle.80+ top fifth50 to 79 above the middleunder 50 below the middle
Top fifth in 2 of 15 measures.
Touches, shots and positions
On the pitch
Busiest in the their half, centre (12%), average spot centre, middle third. Hover or tap a zone.
Own thirdMiddle thirdFinal third
Own third 24%, Middle third 55%, Final third 20%
Brighter means more touches. The dot is the average spot. Attacking to the right.
By competition
The season
| Competition | Apps | Min | Goals | Assists | xG | npxG | xA | Shots | Key passes | Rating |
|---|---|---|---|---|---|---|---|---|---|---|
| Serie A | 9 | 627 | 1 | 0 | 0.53 | 0.53 | 0.51 | 5 | 5 | 7.34 |
| Champions League | 3 | 126 | 0 | 0 | 0.00 | 0.00 | 0.00 | 0 | 0 | 6.00 |


12 games


