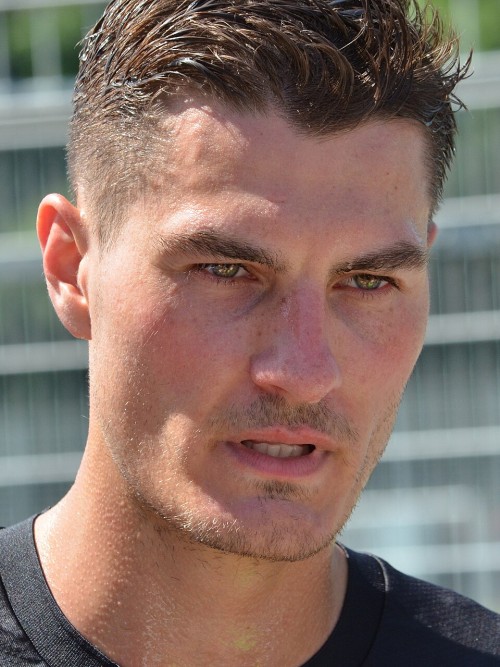
 Bayer Leverkusen
- Games
- 14
- 11 starts
- Minutes
- 1,009
- 72 a game
- Goals
- 11
- 9.0 xG
- Assists
- 2
- 1.3 xA
Player profile
919 min · vs 131 strikers · 3 Nov 2026 · Method
Archetype: Prolific penalty-box striker
Schick is scoring at one of the best rates among strikers, with goals and shots in the top 6% and plenty of touches in the box. He is rarely involved in build-up.
Key strengths
Goals. 1.08 goals per 90, percentile 94.
Shoots. 4.60 shots per 90, percentile 95, with 0.63 non-penalty xG per 90, percentile 86.
Box presence. 7.74 touches in the box per 90, percentile 93.
Interceptions. 0.49 interceptions per 90, percentile 88.
Areas for development
Little build-up. 0.88 passes into the final third per 90, percentile 11.
Similar players
- Thierno Barry EvertonPasses into the final third 11 v 7 and chances created 75 v 74.
- Lassine Sinayoko Paris FCGoals 94 v 89, touches in the box 93 v 85.
- Nicolas Jackson Aston VillaPasses into the final third 11 v 17 and key passes 74 v 71.
Key strengths, areas for development and similar players
Key strengths
Goals. 1.08 goals per 90, percentile 94.
Shoots. 4.60 shots per 90, percentile 95, with 0.63 non-penalty xG per 90, percentile 86.
Box presence. 7.74 touches in the box per 90, percentile 93.
Interceptions. 0.49 interceptions per 90, percentile 88.
Areas for development
Little build-up. 0.88 passes into the final third per 90, percentile 11.
Similar players
- Thierno Barry EvertonPasses into the final third 11 v 7 and chances created 75 v 74.
- Lassine Sinayoko Paris FCGoals 94 v 89, touches in the box 93 v 85.
- Nicolas Jackson Aston VillaPasses into the final third 11 v 17 and key passes 74 v 71.
Against 135 strikers
Against the rest
How to read it. Each number is a percentile: the share of strikers with 450+ minutes this player beats on that measure. 90 means better than 90 out of every 100; 50 is the middle.80+ top fifth50 to 79 above the middleunder 50 below the middle
Top fifth in 5 of 15 measures.
Touches, shots and positions
On the pitch
Busiest in the their box, centre (19%), average spot centre, middle third. Hover or tap a zone.
Own thirdMiddle thirdFinal third
Own third 9%, Middle third 39%, Final third 52%
Brighter means more touches. The dot is the average spot. Attacking to the right.
By competition
The season
| Competition | Apps | Min | Goals | Assists | xG | npxG | xA | Shots | Key passes | Rating |
|---|---|---|---|---|---|---|---|---|---|---|
| Bundesliga | 8 | 614 | 7 | 2 | 5.08 | 5.08 | 0.95 | 31 | 9 | 7.81 |
| Europa League | 4 | 283 | 2 | 0 | 2.69 | 1.12 | 0.34 | 11 | 6 | 7.32 |
| DFB-Pokal | 2 | 112 | 2 | 0 | 1.28 | 0.49 | 0.01 | 7 | 0 | 7.92 |


14 games
Match by match
- v
 Marseille0–190′6.2
- v
 VfB Stuttgart2–490′1 goal7.9
- v
 1. FC Nürnberg5–245′sub1 goal (pen)8.0
- at
 Hoffenheim0–390′booked6.3
- at
 OFI Crete2–064′7.0
- v
 Freiburg2–190′1 goal, 1 assist8.5
- at
 Lech Poznań4–058′sub2 goals (all pens)9.0
- at
 Mainz 054–383′1 goal8.0
- v
 RB Leipzig2–077′1 goal8.0
- v
 NK Celje2–071′7.0
- at
 Augsburg2–227′sub1 goal7.2
- v
 Union Berlin4–067′1 goal, 1 assist8.8
- at
 Elversberg2–390′1 goal7.9
- at
 Wehen Wiesbaden4–067′1 goal7.9