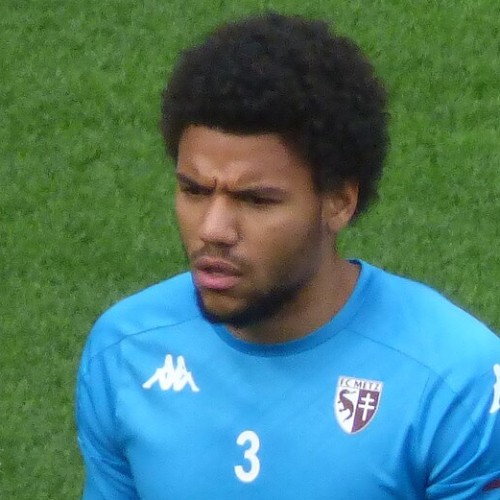
 Lens
- Games
- 13
- 13 starts
- Minutes
- 1,098
- 84 a game
- Goals
- 2
- 2.0 xG
- Assists
- 1
- 0.8 xA
Player profile
1,008 min · vs 227 full-backs · 3 Nov 2026 · Method
Archetype: Attacking wing-back strong in the air
Udol is a goal threat from wing-back, with non-penalty xG and shots in the top 10% of full-backs, and he wins headers and duels. His passing is loose and he rarely beats a man.
Key strengths
Goal threat. 0.17 non-penalty xG per 90, percentile 90, and 1.70 shots per 90, percentile 93.
In the air. 2.14 aerials won per 90, percentile 93.
Wins duels. Wins 59.8% of duels, percentile 80.
Areas for development
Pass accuracy. 77.7% pass accuracy, percentile 16.
Rarely dribbles past players. 0.27 dribbles won per 90, percentile 20.
Expected assists. 0.07 expected assists per 90, percentile 30.
Similar players
- Robin Gosens Schalke 04Aerials won 93 v 87, goals 82 v 81.
- Joško Gvardiol Manchester CityAerials won 93 v 95 and duels won 80 v 75.
- Oso StrasbourgNon-penalty xG 90 v 78 and interceptions 75 v 70.
Key strengths, areas for development and similar players
Key strengths
Goal threat. 0.17 non-penalty xG per 90, percentile 90, and 1.70 shots per 90, percentile 93.
In the air. 2.14 aerials won per 90, percentile 93.
Wins duels. Wins 59.8% of duels, percentile 80.
Areas for development
Pass accuracy. 77.7% pass accuracy, percentile 16.
Rarely dribbles past players. 0.27 dribbles won per 90, percentile 20.
Expected assists. 0.07 expected assists per 90, percentile 30.
Similar players
- Robin Gosens Schalke 04Aerials won 93 v 87, goals 82 v 81.
- Joško Gvardiol Manchester CityAerials won 93 v 95 and duels won 80 v 75.
- Oso StrasbourgNon-penalty xG 90 v 78 and interceptions 75 v 70.
Against 233 full-backs
Against the rest
How to read it. Each number is a percentile: the share of full-backs with 450+ minutes this player beats on that measure. 90 means better than 90 out of every 100; 50 is the middle.80+ top fifth50 to 79 above the middleunder 50 below the middle
Top fifth in 3 of 15 measures.
Touches, shots and positions
On the pitch
Busiest in the own third, left (24%), average spot left wing, middle third. Hover or tap a zone.
Own thirdMiddle thirdFinal third
Own third 35%, Middle third 44%, Final third 21%
Brighter means more touches. The dot is the average spot. Attacking to the right.
By competition
The season
| Competition | Apps | Min | Goals | Assists | xG | npxG | xA | Shots | Key passes | Rating |
|---|---|---|---|---|---|---|---|---|---|---|
| Ligue 1 | 8 | 648 | 2 | 0 | 1.46 | 1.46 | 0.49 | 8 | 9 | 7.16 |
| Champions League | 4 | 360 | 0 | 0 | 0.47 | 0.47 | 0.29 | 10 | 3 | 6.51 |
| Trophée des Champions | 1 | 90 | 0 | 1 | 0.10 | 0.10 | 0.06 | 3 | 0 | 7.41 |


13 games


