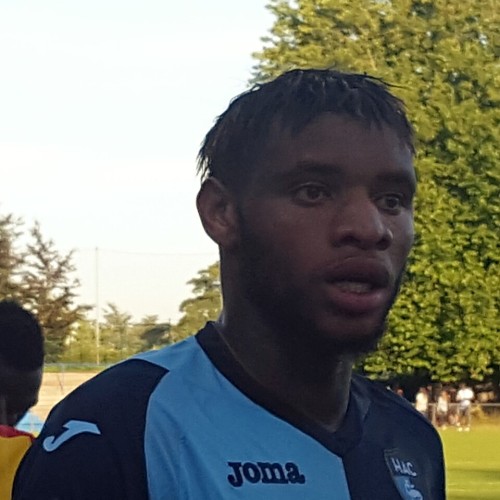
 AEK Athens
- Games
- 4
- 4 starts
- Minutes
- 360
- 90 a game
- Goals
- 0
- 0.4 xG
- Assists
- 0
- 0.0 xA
Player profile
270 min · vs 275 centre-backs · 3 Nov 2026 · Method
Archetype: Safe-passing centre-back who threatens at set pieces
Moukoudi rarely misplaces a pass, in the top 3% of centre-backs for accuracy, and is a threat in the box, with npxG in the top 8%. He plays it short rather than forward, creates nothing, and recovers fewer loose balls than almost anyone in the group. From 270 minutes.
Key strengths
Passing accuracy. 94.9%, top 3%.
Goal threat. 0.14 npxG per 90, top 8%.
Shooting. 1.00 shots per 90, top 19%.
Areas for development
Recoveries. 1.60 per 90, 1st percentile.
Progression. 2.60 passes into the final third per 90, 5th percentile.
Chance creation. 0.00 chances created per 90, the lowest in the group.
Similar players
- Thomas Kristensen AtalantaPass accuracy 97 v 92 and tackles 11 v 6.
- Luka Lochoshvili 1. FC KölnTouches in the box 78 v 79 and passes into the final third 5 v 15.
- Trevoh Chalobah ComoPass accuracy 97 v 98 and aerials won 26 v 19.
Key strengths, areas for development and similar players
Key strengths
Passing accuracy. 94.9%, top 3%.
Goal threat. 0.14 npxG per 90, top 8%.
Shooting. 1.00 shots per 90, top 19%.
Areas for development
Recoveries. 1.60 per 90, 1st percentile.
Progression. 2.60 passes into the final third per 90, 5th percentile.
Chance creation. 0.00 chances created per 90, the lowest in the group.
Similar players
- Thomas Kristensen AtalantaPass accuracy 97 v 92 and tackles 11 v 6.
- Luka Lochoshvili 1. FC KölnTouches in the box 78 v 79 and passes into the final third 5 v 15.
- Trevoh Chalobah ComoPass accuracy 97 v 98 and aerials won 26 v 19.
Against 279 centre-backs
Against the rest
How to read it. Each number is a percentile: the share of centre-backs with 450+ minutes this player beats on that measure. 90 means better than 90 out of every 100; 50 is the middle.80+ top fifth50 to 79 above the middleunder 50 below the middle
Top fifth in 3 of 13 measures.
Touches, shots and positions
On the pitch
Busiest in the own third, right (22%), average spot right half-space, own third. Hover or tap a zone.
Own thirdMiddle thirdFinal third
Own third 68%, Middle third 28%, Final third 4%
Brighter means more touches. The dot is the average spot. Attacking to the right.
By competition
The season
| Competition | Apps | Min | Goals | Assists | xG | npxG | xA | Shots | Key passes | Rating |
|---|---|---|---|---|---|---|---|---|---|---|
| Champions League | 4 | 360 | 0 | 0 | 0.36 | 0.36 | 0.01 | 5 | 0 | 6.16 |

4 games


