 Lyon
- Games
- 9
- 8 starts
- Minutes
- 628
- 70 a game
- Goals
- 5
- 2.9 xG
- Assists
- 1
- 1.3 xA
Player profile
628 min · vs 149 wingers · 3 Nov 2026 · Method
Archetype: Goalscoring winger
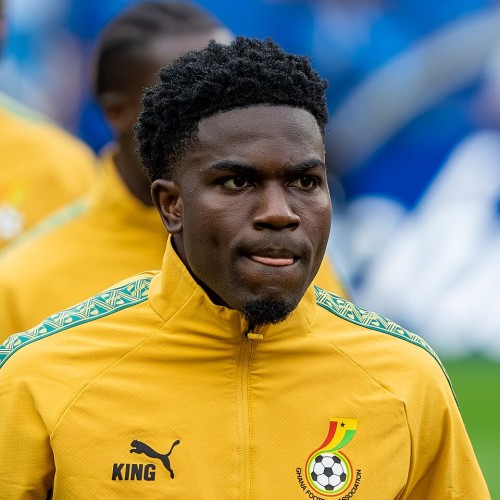
Nuamah has 4 Ligue 1 goals from 2.44 xG for Lyon, scoring more than almost any winger, and gets good chances. He plays the ball forward less than anyone in the group and does very little defending. From 628 minutes.
Key strengths
Scores. Goals 0.59 per 90 (top 4% of wingers) and 4 Ligue 1 goals from 2.44 xG.
Good chances. Non-penalty xG 0.35 per 90, top 13%.
Wins his duels. Duels won 49.3%, 68th percentile.
Areas for development
No progression. Passes into the final third 0.94 per 90, 1st percentile.
Little defending. Tackles 0.35 per 90 (3rd percentile) and recoveries 2.23 (2nd).
Creates little. Key passes 1.06 per 90, 23rd percentile.
Similar players
- Bukayo Saka ArsenalGoals 96 v 90 and non-penalty xG 87 v 97.
- Malick Fofana SunderlandRecoveries 2 v 20 and interceptions 38 v 39.
- Víctor Muñoz LiverpoolPass accuracy 33 v 34 and shots 74 v 69.
Key strengths, areas for development and similar players
Key strengths
Scores. Goals 0.59 per 90 (top 4% of wingers) and 4 Ligue 1 goals from 2.44 xG.
Good chances. Non-penalty xG 0.35 per 90, top 13%.
Wins his duels. Duels won 49.3%, 68th percentile.
Areas for development
No progression. Passes into the final third 0.94 per 90, 1st percentile.
Little defending. Tackles 0.35 per 90 (3rd percentile) and recoveries 2.23 (2nd).
Creates little. Key passes 1.06 per 90, 23rd percentile.
Similar players
- Bukayo Saka ArsenalGoals 96 v 90 and non-penalty xG 87 v 97.
- Malick Fofana SunderlandRecoveries 2 v 20 and interceptions 38 v 39.
- Víctor Muñoz LiverpoolPass accuracy 33 v 34 and shots 74 v 69.
Against 154 wingers
Against the rest
How to read it. Each number is a percentile: the share of wingers with 450+ minutes this player beats on that measure. 90 means better than 90 out of every 100; 50 is the middle.80+ top fifth50 to 79 above the middleunder 50 below the middle
Top fifth in 2 of 15 measures.
Touches, shots and positions
On the pitch
Busiest in the final third, right (24%), average spot right half-space, middle third. Hover or tap a zone.
Own thirdMiddle thirdFinal third
Own third 12%, Middle third 30%, Final third 58%
Brighter means more touches. The dot is the average spot. Attacking to the right.
By competition
The season
| Competition | Apps | Min | Goals | Assists | xG | npxG | xA | Shots | Key passes | Rating |
|---|---|---|---|---|---|---|---|---|---|---|
| Ligue 1 | 7 | 543 | 4 | 1 | 2.44 | 2.44 | 1.06 | 20 | 8 | 7.50 |
| Europa League | 2 | 85 | 1 | 0 | 0.47 | 0.47 | 0.19 | 3 | 1 | 7.70 |


9 games


